The Mandelbrot Set!
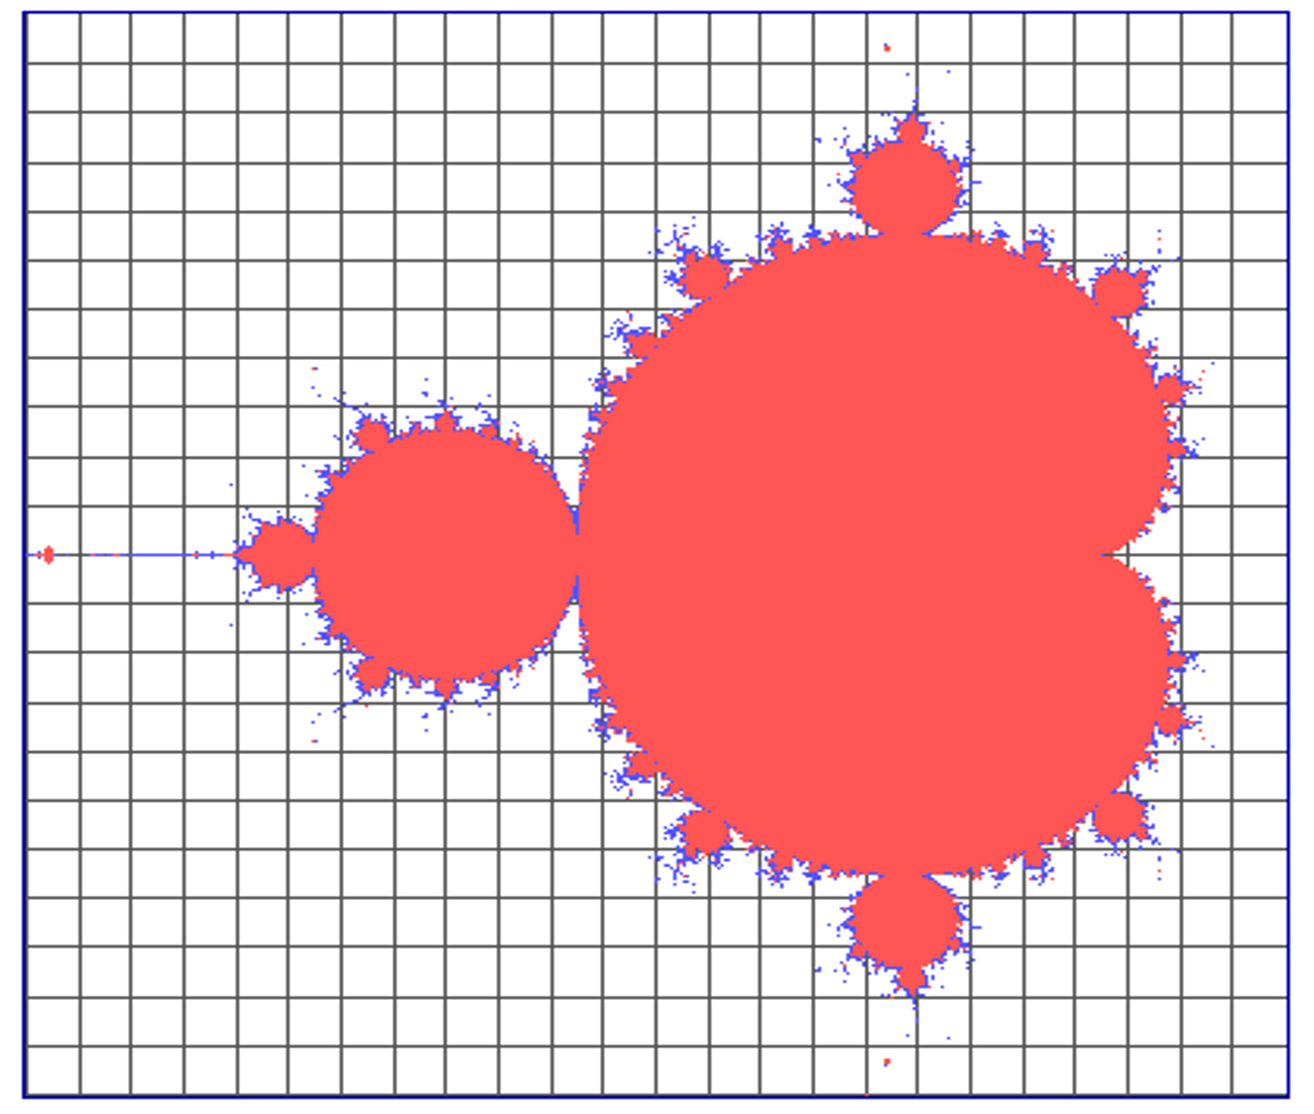
The shape to the right is a rendition of the famous 'Mandelbrot Set' - a picture generated using 'complex numbers' put in a mathematical feedback loop.
The process:
- A complex point is selected in the grid: z0 = a + bi (If this seems weird, see your math teacher!)
- This value is squared and then added to the original z0.
- The process is repeated where new zs are computed from their previous values. The formula looks like like this:
zk+1 = (zk)2 + z0 - The process continues as long as the |zk+1| < 2 or k+1 exceeds a pre-established maximum
- If a given z0, when iterated in this way, never has an absolute value that exceeds 2, the color of the z0 is painted the salmon color you see in the picture. The blue highlights are places where the k+1 exceeded a maximum value, often around 200-300.
- The result is the picture you see to the right
“Being a language, mathematics may be used not only
to inform but also, among other things, to seduce.”
Orbits?
In this app, we are not drawing the Mandelbrot Set, we are graphing the trajectories of the z-values as they are computed. The colors of the zs are dependent on the number of calculations performed.
You choose the starter z0 by clicking in the canvas or by using the user-input text fields for a0 and b0 (The initial point is shown in white).
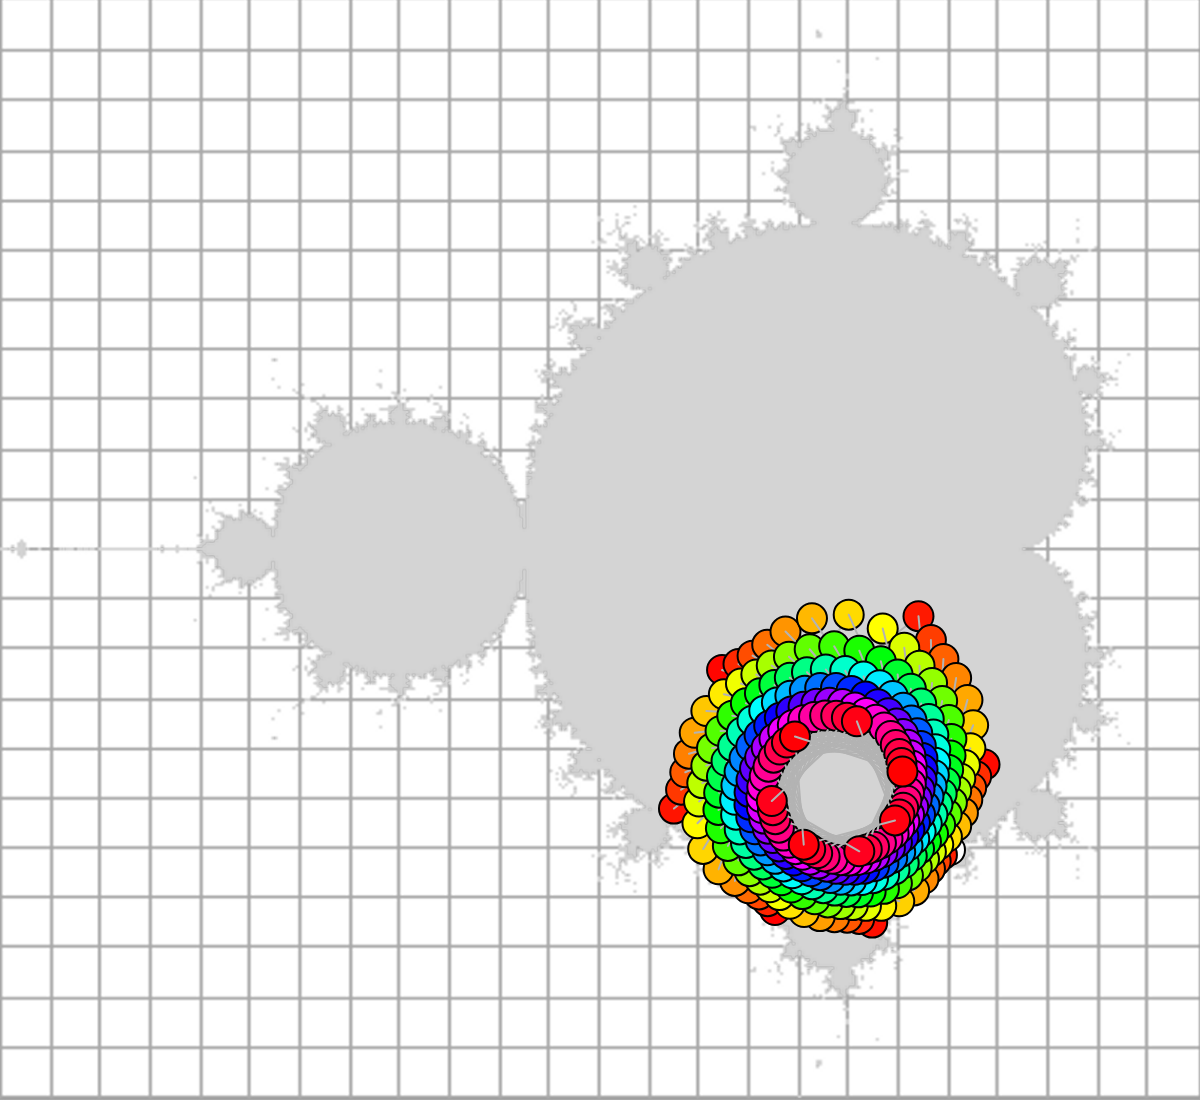
The closer you are to the perimeter of the Mandelbrot, the more interesting the orbits! By default, the canvas shows an overlay of the Mandelbrot set. You can use the "H/S Bg" (Hide/Show Background) button to remove that overlay but it's helpful to see it: Remember, the cool kids hang around the perimeter of the Mandelbrot!
Getting started? Try values around z0 = .1 -.6i
Additional Features!
Upon completion of an orbit, you can use the 'Nudge' button to scoot a z0 left, right, up or down by an increment you can choose with the 'Inc' select menu. You can also move to the closed gridline intersection with the 'Nearest Grid Pt.' option.
Also notice: orbits are chronicled in a table beneath the graph!

A newer feature sports the ability to type in a user-input value for z0 by specifying a0 and b0.
Lovely examples ♥
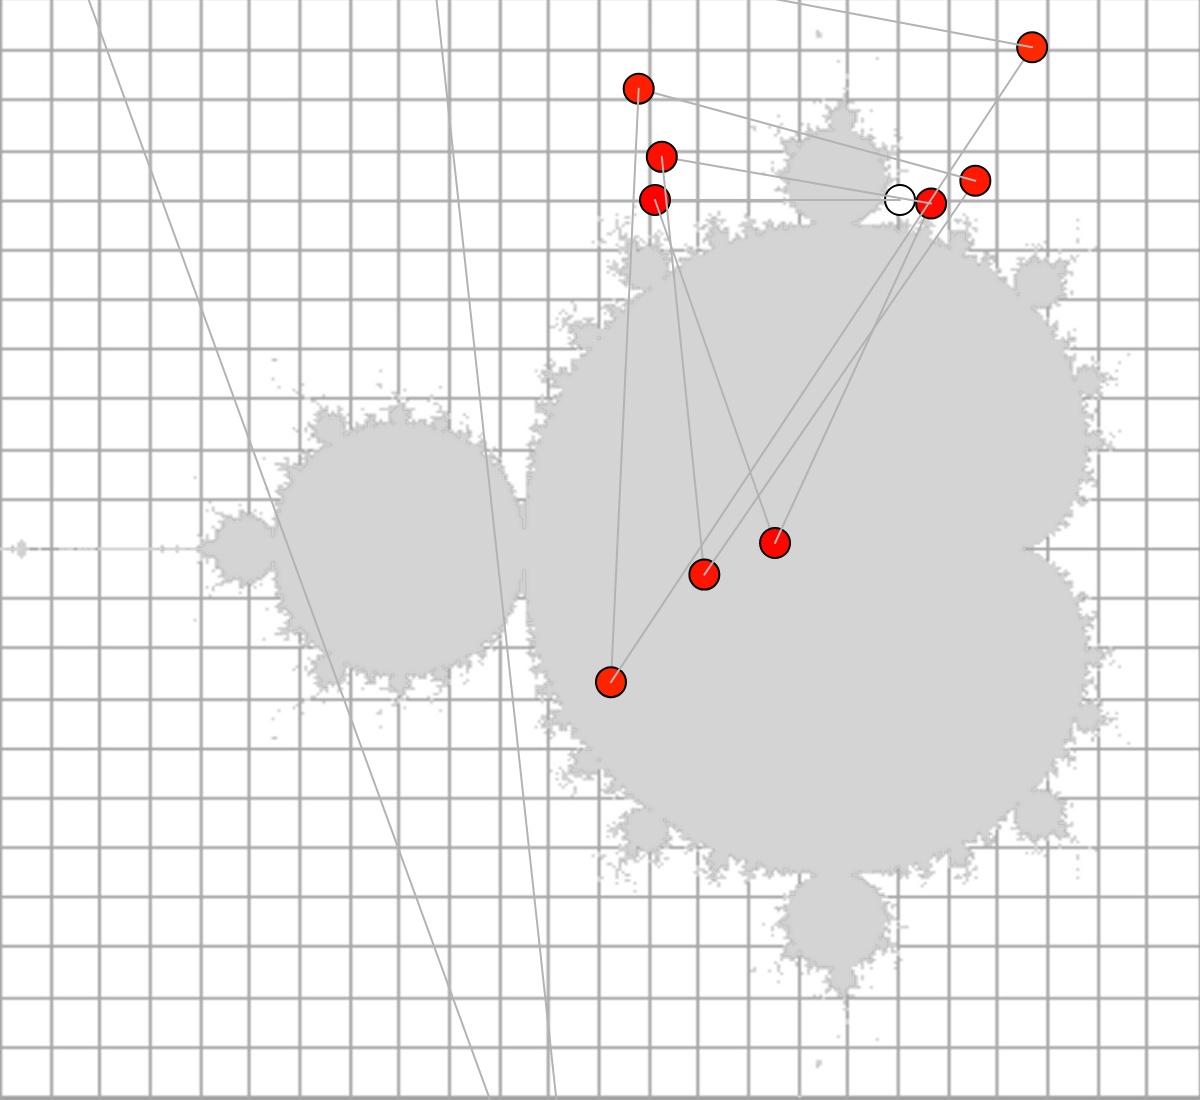
Two examples show 'convergent' orbits where the distance of a z never exceeds 2, even after 300 iterations. Those tend to occur inside or around the Mandelbrot. The example to the right shows an orbit that 'diverges' and 'escapes' a trapped orbit. This tends to occur when the starter z0 is further away from the Mandelbrot set.
Sometimes, orbits cluster around 'preferred' locations even though they never 'escape.' Nudging them from their initial state can make the orbit 'blow up' and diverge. Try it!

'Click and Nudge'
'Manually Input/Edit z0, then Nudge'
Enter a0 in [-1.8, .6] and b0 in [-1.1, 1.1]
z0:
Iterations: 0 of 300
zfinal:
|zfinal|:
Orbit Data
Bottom of Table| Iteration, k | zk (aka, zold) | zk+1 (aka, znew) | |zk+1| |
|---|---|---|---|
| 0 | --- | --- |